Fix a failed deployment
Only here because something broke?
Good, you are in the right place. If your deployment actually succeeded (a green checkmark, and the site works), you do not need this page at all. Head back to finish checking your site.
A red X in the Actions tab means the deployment failed. Failures at this stage are normal and fixable, and the cause is always recorded somewhere in a log. This page walks you from the red X to a green checkmark.
Read the error
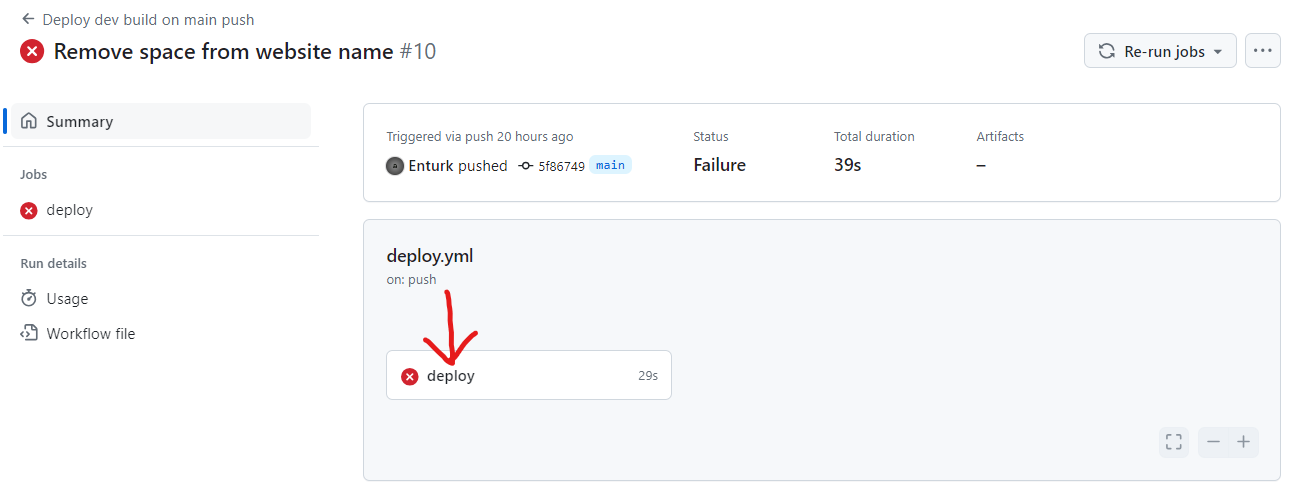
- In the Actions tab, click the failed (red X) run.
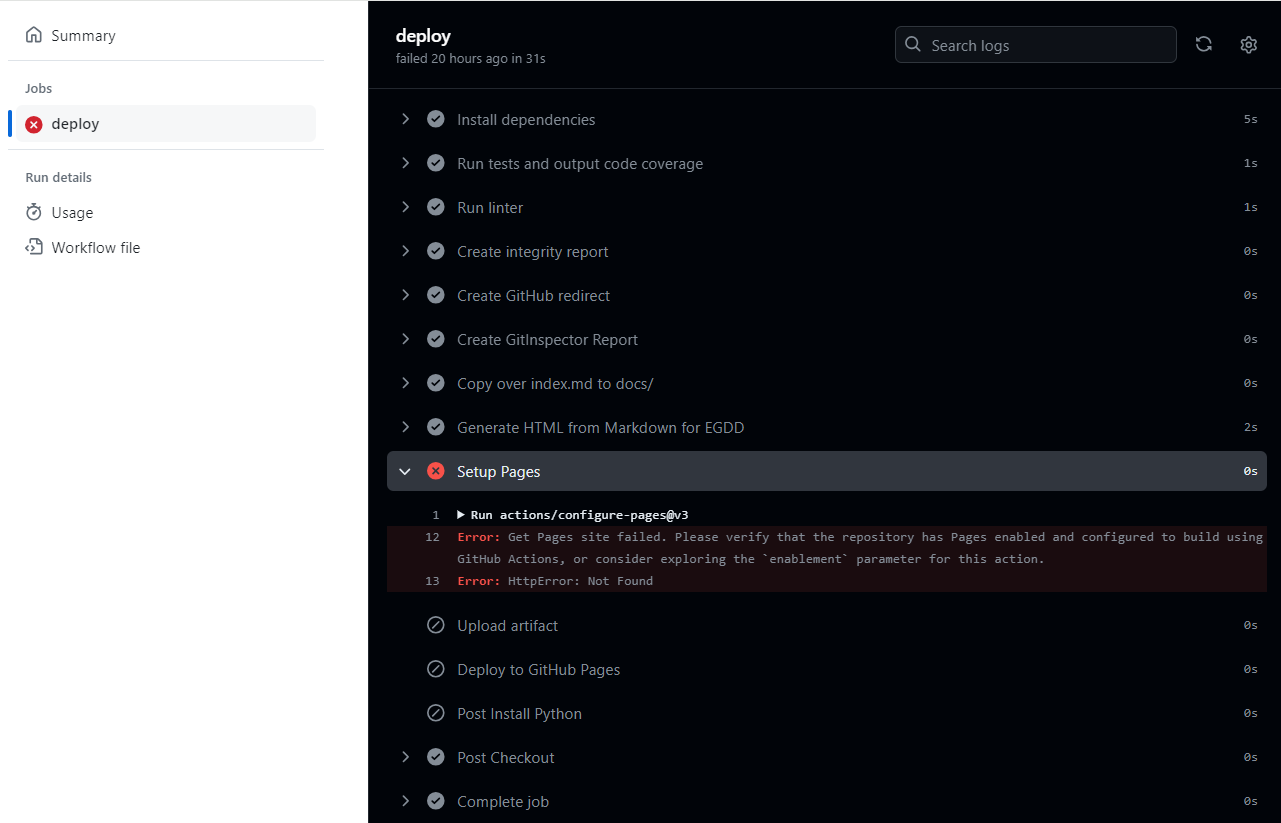
- Click the red X inside it to open the job, then expand the failing step to see the log.
- Read the last several lines. The actual error is almost always named there, often with a Python error message you already know how to read.
Old failed runs in the list do not matter. Only the most recent run counts, so a history of red is fine once the top one is green.
Show what a failed run looks like
Clicking the red X opens the run, and the failing step within it:
Expanding the failing step shows the log with the actual error; this one is a missing Pages configuration:
The usual suspects
- Pages not enabled. The log reports an error about Pages or permissions. The fix is Settings → Pages → Source → GitHub Actions, and then running the workflow again. This is the most common failure on a first deploy.
- A syntax error in your code. The log shows a Python traceback.
Fix the code locally (where you can run it), then commit the fixed
main.pyand redeploy. If it does not run on your computer, it will not deploy. - A missing file. Your program opens a file or shows an image that
was never uploaded to the repository. Upload it next to
main.pyand redeploy. For details, see works locally, 404s deployed. - A wrong filename. The deploy workflow expects your program to be
named
main.py, exactly. Renaming the file breaks the build, so keep your code inmain.py. - An import the browser cannot satisfy. Not every third-party library works in the deployed runtime. See a library import fails in the browser.
The deployment dashboard
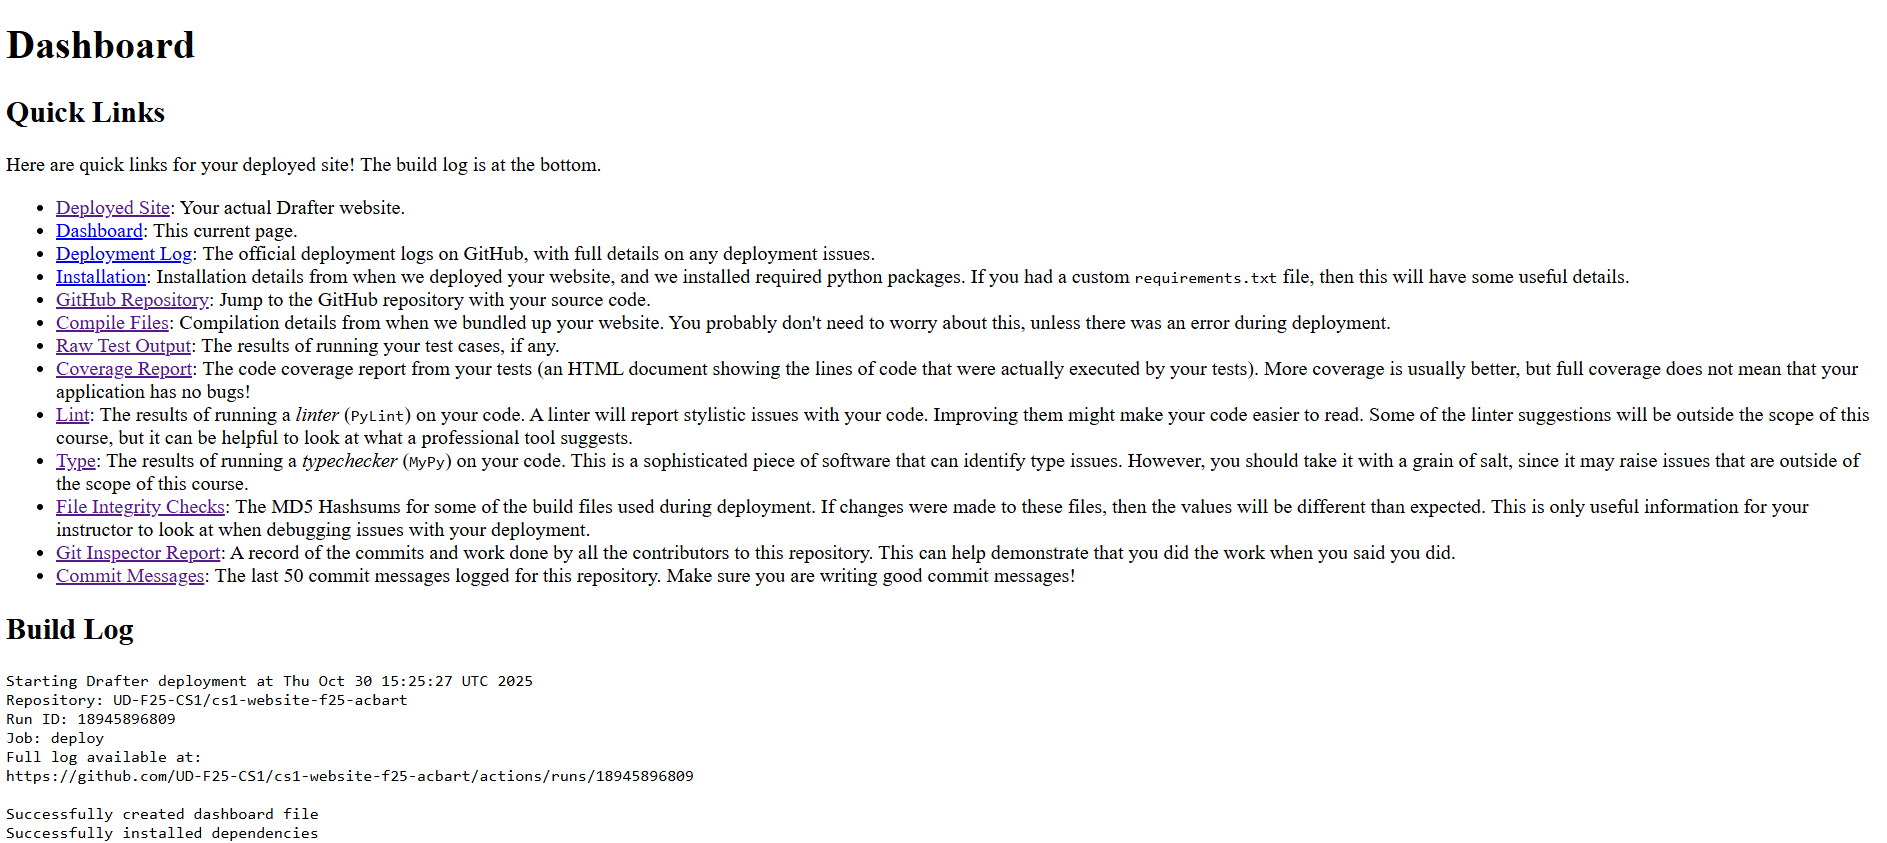
Whether the deploy succeeded or failed, your site has a diagnostic page:
take your deployed URL and add dashboard/ to the end, like
https://your-username.github.io/your-repository/dashboard/.
Errors and warnings appear at the top, followed by quick links (the site, the logs, the repository, your tests) and the full build log of every step Drafter took. When a deploy partly works, the dashboard is the fastest way to see which parts succeeded and which failed.
Show the dashboard
Retry
Deployments do not rerun themselves. After every fix, go to the Actions tab, select the deploy workflow, and click Run workflow. Then watch the new run at the top of the list.
Still stuck?
- Confirm the app runs locally with no errors and passing tests.
- Compare your repository against the publish steps one by one; most stubborn failures are a skipped step.
- Bring the exact error line from the log to Getting help. A report of "deployment failed" is not enough information to debug with, but the real error text is.